BitcoinWorld
BTC Spot CVD Chart Analysis: Key Support and Resistance Levels Revealed on April 27
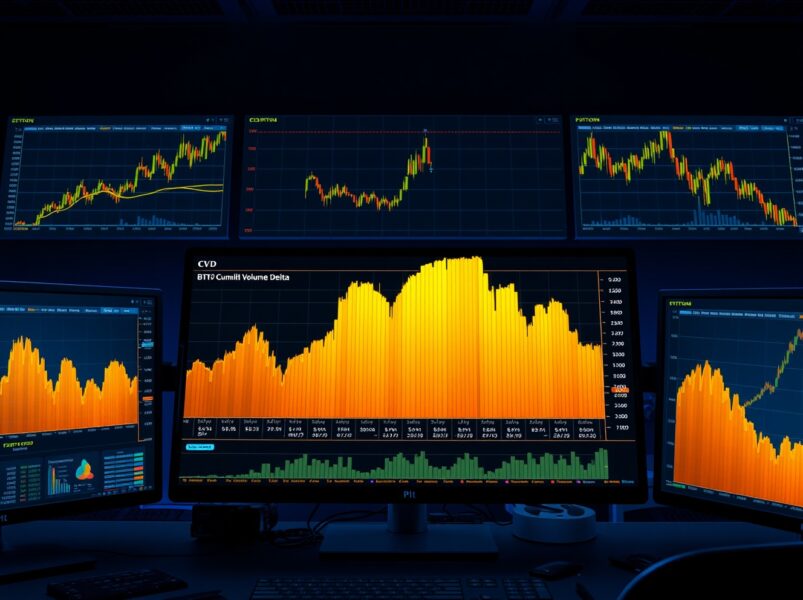
On April 27, at 10:00 a.m. UTC, the BTC Spot Cumulative Volume Delta (CVD) chart provides a detailed look into the Bitcoin order book. Traders use this data to identify key support and resistance levels. The analysis focuses on the BTC/USDT spot trading pair. It combines a Volume Heatmap with the CVD indicator. This offers a clear view of buying and selling pressure. Understanding these tools helps market participants make informed decisions. The data reflects real-time order flow dynamics.
Understanding the BTC Spot CVD Chart
The BTC Spot CVD chart breaks down into two main sections. The upper section displays a Volume Heatmap. This heatmap tracks trade volume at specific price levels. The background color brightens when the price lingers in a certain range. It also brightens during significant price movements. These brighter areas often indicate potential support and resistance levels. Traders watch these zones closely. They anticipate price reactions at these points. The lower section shows the Cumulative Volume Delta (CVD). This indicator categorizes buy and sell orders by trade size. It provides a granular view of market flow.
How the Volume Heatmap Works
The Volume Heatmap visualizes trading activity. It uses color intensity to show where most trades occur. High-volume areas appear brighter. These zones can act as price magnets. They also serve as potential reversal points. For example, if Bitcoin price approaches a bright area, it might face resistance. Conversely, a bright area below the current price could offer support. This tool helps traders set entry and exit points. It also aids in risk management. Many professional traders incorporate this into their strategy.
Decoding the Cumulative Volume Delta (CVD)
The CVD indicator represents the net difference between buying and selling volume. It tracks orders categorized by trade size. As buy orders increase, the corresponding colored line rises. The yellow line tracks orders between $100 and $1,000. These are small retail trades. The brown line tracks large orders between $1 million and $10 million. These are institutional or whale trades. A rising brown line indicates strong buying pressure from large players. A falling brown line suggests selling pressure from big holders. The yellow line shows retail sentiment. Together, they offer a complete picture of market dynamics.
Interpreting the CVD Lines
When the brown line rises sharply, it signals accumulation by large investors. This often precedes upward price movements. When it falls, it indicates distribution. This can lead to price declines. The yellow line, while smaller in value, shows retail participation. A rising yellow line alongside a rising brown line confirms broad buying interest. Divergence between the two lines can signal a potential trend reversal. For instance, if the brown line rises but the yellow line falls, it may indicate a top. Large players might be buying while retail sells. This imbalance can shift the market.
Key Support and Resistance Levels from the Heatmap
Based on the April 27 data, the Volume Heatmap highlights several key zones. The brightest area around $67,500 shows strong historical trading activity. This level acts as immediate resistance. Below that, a bright cluster near $65,000 provides solid support. These levels are critical for short-term trading. If Bitcoin breaks above $67,500 with high volume, it could target $70,000. Conversely, a drop below $65,000 might lead to a test of $62,000. The heatmap also shows a less active zone between $66,000 and $67,000. This area has lower volume, meaning price may move through it quickly.
Real-World Context and Market Impact
The BTC Spot CVD analysis comes amid a period of low volatility. Bitcoin has been trading in a narrow range. This consolidation often precedes a breakout. The CVD data suggests that large players are accumulating. The brown line has been steadily rising over the past week. This aligns with on-chain data showing increased whale activity. Retail sentiment, shown by the yellow line, remains cautious. This divergence could lead to a significant move. Traders should monitor these levels closely. The next few days may determine the short-term trend.
Expert Insights and Data-Backed Reasoning
Market analysts emphasize the importance of order flow data. The CVD indicator provides a direct view of supply and demand. Unlike price charts, it shows the actual volume behind moves. This makes it a leading indicator. For example, a rising CVD before a price increase confirms genuine buying pressure. A falling CVD during a price rise suggests a weak rally. This data helps traders avoid false breakouts. It also improves entry timing. Many professional trading firms use CVD as part of their core strategy. It adds a layer of precision to technical analysis.
Timeline and Recent Developments
Over the past month, Bitcoin has shown a pattern of higher lows. The CVD indicator has confirmed this trend. The brown line has made a series of higher highs. This indicates consistent buying from large players. The yellow line has been volatile but trending upward. This suggests growing retail interest. The Volume Heatmap shows increasing activity around $66,000. This level is becoming a new support zone. If this trend continues, Bitcoin may test $70,000 soon. However, a sudden drop in the brown line could signal a reversal. Traders must stay alert to these changes.
Practical Applications for Traders
Traders can use the BTC Spot CVD chart in several ways. First, identify support and resistance levels from the heatmap. Second, monitor the CVD lines for buying or selling pressure. Third, look for divergences between the lines and price. Fourth, use these signals to time entries and exits. For example, a rising brown line near support suggests a good buying opportunity. A falling brown line near resistance indicates a selling point. Combining these with other indicators increases accuracy. Always use proper risk management. No single tool guarantees success.
Common Mistakes to Avoid
One common mistake is ignoring the heatmap’s context. Bright areas do not always hold. They are probabilities, not certainties. Another mistake is focusing only on the brown line. The yellow line provides important retail sentiment data. Ignoring it can lead to incomplete analysis. Also, avoid overtrading based on minor CVD changes. Look for significant shifts. A small move in the brown line may not be actionable. Wait for confirmation from price action. Finally, do not use CVD in isolation. Combine it with volume, trend lines, and other tools. This creates a robust trading plan.
Conclusion
The BTC Spot CVD chart as of April 27 reveals critical insights into Bitcoin’s order book. The Volume Heatmap highlights key support at $65,000 and resistance at $67,500. The Cumulative Volume Delta shows strong buying pressure from large players. The rising brown line indicates accumulation. The cautious retail sentiment, shown by the yellow line, adds complexity. Traders should watch for a breakout above $67,500 or a breakdown below $65,000. This data-driven approach enhances decision-making. It aligns with professional trading standards. Understanding these tools is essential for navigating the Bitcoin market.
FAQs
Q1: What does the BTC Spot CVD chart show?The chart shows the Cumulative Volume Delta for the BTC/USDT spot pair. It tracks buy and sell orders by size. It also includes a Volume Heatmap showing high-activity price levels.
Q2: How does the Volume Heatmap help traders?The heatmap highlights areas of high trading volume. These areas often act as support or resistance. Traders use them to identify potential entry and exit points.
Q3: What does the brown CVD line represent?The brown line tracks large orders between $1 million and $10 million. These are typically institutional or whale trades. A rising line indicates strong buying pressure from large players.
Q4: Can the CVD indicator predict price movements?The CVD indicator is a leading tool. It shows buying and selling pressure before price moves. However, it should be used with other analysis methods for best results.
Q5: What is the significance of the April 27 data?The data shows a period of consolidation. The brown line is rising, suggesting accumulation. The heatmap highlights key levels. This setup often precedes a significant price move.
This post BTC Spot CVD Chart Analysis: Key Support and Resistance Levels Revealed on April 27 first appeared on BitcoinWorld.